

6.4.11 Performance Optimization on VPS/VDS and Dedicated Servers

When a visitor opens your website, the browser sends a request to the server. The server processes it and returns the page. The faster the server handles this process, the higher the performance.
Low performance appears through several symptoms: the website opens slowly, it “goes down” during visitor spikes, the ISPmanager or cPanel control panel responds with delays, and errors such as 500 Internal Server Error or 504 Gateway Timeout appear in the logs.
The three main server resources that should be monitored:
| Resource | What it does | Sign of shortage |
|---|---|---|
| CPU (processor) | Performs calculations | High load average, PHP slowdowns |
| RAM (memory) | Stores data “on the fly” | Swap is active, the OOM killer terminates processes |
| Disk I/O (disk) | Reads/writes files and databases | Long MySQL queries, slow file loading |
Important: This article is intended primarily for servers without a control panel. If ISPmanager, cPanel, or another panel is used on the server, do not change Apache, Nginx, PHP-FPM, or system service configurations directly without checking the panel documentation. The panel may store its own configuration templates, overwrite files during updates, and depend on services that may appear unnecessary. A safer approach: first check whether the required setting is available in the panel interface or in its standard templates. Before making manual changes, create a backup copy of the configuration file and save the rollback command.
Common Beginner Mistakes
Making changes without a backup. Before any serious configuration file change, make a copy of it:
cp /etc/nginx/nginx.conf /etc/nginx/nginx.conf.bak
Setting innodb_buffer_pool_size too high. If you allocate more RAM to MySQL than the server has, it will not start. Rule: no more than 70% of the total RAM, while also accounting for all other services.
Ignoring logs. Most performance problems can be seen in logs several hours before the website “goes down.” Check /var/log/ regularly.
Configuring everything at once. Make changes one by one and observe the result. This way, you will understand exactly what helped and what did not.
Not restarting services after configuration changes. Changes in configuration files take effect only after the corresponding service is restarted.
Load Diagnostics
Before changing anything, you need to understand which specific resource is overloaded. Making changes “blindly” is a typical beginner mistake.
Connect to the server via SSH
ssh root@your_IP_address
General Load
Check the overall load in real time by running the command:
top
Press q to exit. Pay attention to the load average line — three numbers show the average load over 1, 5, and 15 minutes. If the values consistently exceed the number of CPU cores on your server, this is a sign of overload.
For a more convenient display, install htop:
# For Debian/Ubuntu
apt install htop -y

# For CentOS/AlmaLinux
yum install htop -y
htop

RAM
To check RAM usage, use the following command:
free -h

The free -h command shows the total amount of RAM, how much RAM is already used, how much is available, and whether swap is being used.
If Swap used is greater than zero, the server is already using virtual memory on disk. This is not always critical, but under high load it can significantly slow down operation because disk is much slower than RAM.
Pay special attention to the following signs:
- Low available memory — if the value in the
availablecolumn is too low. - Swap is actively used — this may indicate a shortage of RAM.
- Memory runs out quickly after restarting services — this may indicate a memory leak or incorrect application settings.
Analyzing RAM Usage
ps aux --sort=-%mem | head -15

This command will show the 15 processes that consume the most memory. Remember or write down their names — they will be useful for further analysis.
Next, you need to check what these processes are and why they are using this amount of RAM. If RAM usage is higher than normal for your project or server, you need to determine the cause: high load, incorrect settings, memory leak, too many workers/processes, or unnecessary services running.
After the analysis, you can make one of the following decisions:
- Optimize process settings — for example, reduce the number of workers, limit memory consumption, or change MySQL/MariaDB, PHP-FPM, web server, or other service parameters.
- Disable unnecessary services — if the process is not used and is not needed for the website or server to operate.
- Increase the amount of RAM — if the load is normal, but the current amount of RAM is objectively insufficient.
Important: you should not terminate or disable processes without understanding their purpose, as this may disrupt the website, database, or system services.
Disk Subsystem
The following command helps audit disk usage:
df -h

The df -h command shows how much space is used and how much free space remains on the server’s file system partitions.
If the / partition (root) is more than 85% full, this is a critical problem that must be addressed first. When there is not enough free space, the server may become unstable: websites may stop opening, databases may stop writing data, and services may crash.
The problem can be solved in two main ways:
- Delete unnecessary data — old archives, backups, temporary files, logs, cache, unused website files, or other data that is no longer needed.
- Increase disk space — if the data cannot be deleted or the project really requires more space, you need to expand the disk/plan or connect additional storage.
Before deleting files, it is important to first determine exactly what is taking up disk space.
Please note: detailed instructions for finding large files and directories via SSH are described in a separate article: How to find what is taking up disk space via SSH
Check Disk Subsystem Speed
Sometimes the problem is not that disk space has run out, but that the disk is processing read and write operations too slowly.
If top or htop shows a high %wa value, it means the processor is often idle while waiting for disk read or write operations. This usually indicates not a CPU shortage, but a disk subsystem problem: a slow disk, high database load, active swap usage, backups, massive log writing, or heavy file operations.
In top, the %wa value is displayed in the CPU line:
top
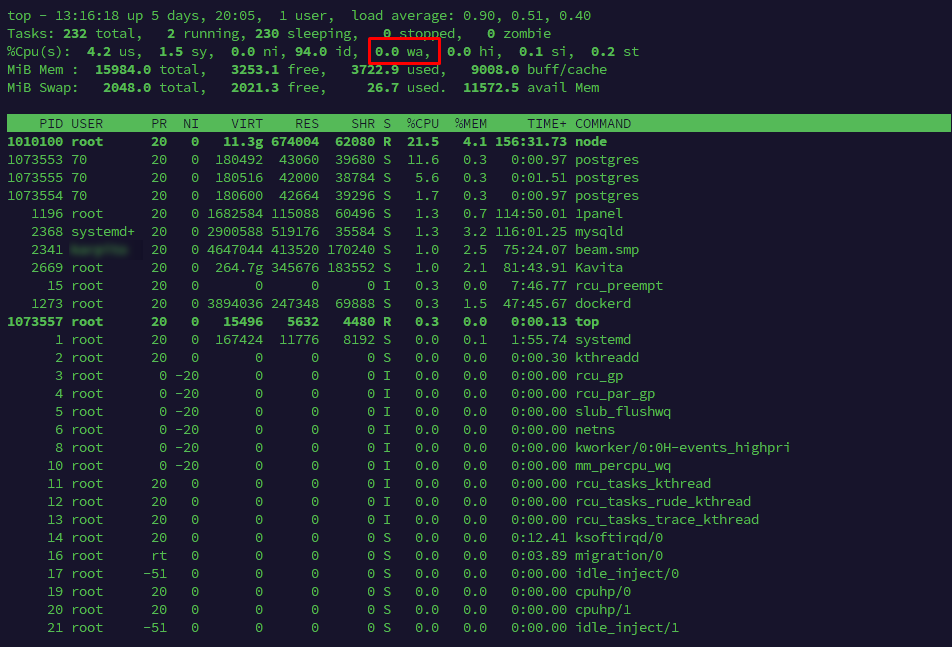
If %wa is consistently high, for example 20–30% or more, the server may slow down even when CPU load is not high. In this case, you need to check which processes are actively reading or writing data to disk.
Install tools for Disk I/O analysis:
# For Debian/Ubuntu
apt install iotop atop -y

# For CentOS/AlmaLinux
yum install iotop atop -y
Check current disk activity by process:
iotop

To display only processes that are currently performing read or write operations, you can use:
iotop -o

You can also use atop to analyze disk load:
atop -Dd

Pay attention to MySQL/MariaDB, PHP-FPM, Apache/Nginx processes, backup scripts, archivers, antivirus scanners, and tasks that actively work with logs. If they are the ones creating high disk activity, further optimization should focus not on the CPU, but on the database, swap, logs, caching, or background task schedules.
Note: if you want to better understand how to analyze server load via SSH, use the separate instruction.
Backing Up Configuration Files
Before changing a configuration, save a copy of the original file. This will allow you to quickly roll back the change if the service does not start after a restart or the control panel begins to work incorrectly.
# Nginx
cp /etc/nginx/nginx.conf /etc/nginx/nginx.conf.bak-$(date +%F)

# Apache on Debian/Ubuntu
cp /etc/apache2/apache2.conf /etc/apache2/apache2.conf.bak-$(date +%F)

# Apache on CentOS/AlmaLinux
cp /etc/httpd/conf/httpd.conf /etc/httpd/conf/httpd.conf.bak-$(date +%F)

# PHP-FPM, if PHP 8.1 is used
cp /etc/php/8.1/fpm/pool.d/www.conf /etc/php/8.1/fpm/pool.d/www.conf.bak-$(date +%F)
After editing, check the configuration syntax before restarting or reloading the service. To roll back, restore the backup copy in place of the original file and check the configuration again.
cp /etc/nginx/nginx.conf.bak-YYYY-MM-DD /etc/nginx/nginx.conf
nginx -t && systemctl reload nginx
Web Server Optimization (Apache / Nginx)
A web server is a program that receives requests from browsers and serves website files. Most VPS servers with cPanel use Apache, while ISPmanager more often uses Nginx or an Nginx + Apache combination.
Configuring Apache2
By default, Apache works in Prefork mode, which creates a separate process for each request. This is wasteful in terms of memory. Event mode handles more connections with fewer resources.
# Check the current mode
apache2ctl -V | grep MPM
If you see Server MPM: prefork, switch modes:
a2dismod mpm_prefork
a2enmod mpm_event
systemctl restart apache2
Important: if you use mod_php instead of PHP-FPM, switching to Event may cause errors. First, check your control panel documentation.
Apache Limits
To configure Apache limits, open the main configuration file:
# Debian/Ubuntu:
nano /etc/apache2/apache2.conf
# or for CentOS/AlmaLinux:
nano /etc/httpd/conf/httpd.conf
Find or add the <IfModule mpm_event_module> section and set the parameters according to your plan:
<IfModule mpm_event_module>
    StartServers             2
    MinSpareThreads         25
    MaxSpareThreads         75
    ThreadLimit             64
    ThreadsPerChild         25
    MaxRequestWorkers      150
    MaxConnectionsPerChild   0
</IfModule>
For a VPS with 2 GB of RAM, reduce MaxRequestWorkers to 100.
Nginx: Basic Optimization
Open the main Nginx configuration file:
nano /etc/nginx/nginx.conf
Before making changes, create a backup copy of the file:
cp /etc/nginx/nginx.conf /etc/nginx/nginx.conf.bak
Check or add the basic parameters:
# Number of worker processes = number of CPU cores
worker_processes auto;

events {
    # Maximum number of connections per worker process
    worker_connections 2048;

    # Efficient connection processing method for Linux
    use epoll;
}

http {
    # Response compression
    gzip on;
    gzip_disable "msie6";
    gzip_types text/plain text/css application/json application/javascript;
    gzip_min_length 1024;

    # Static file transfer optimization
    tcp_nopush on;
    tcp_nodelay on;

    # Open file cache
    open_file_cache max=10000 inactive=30s;
    open_file_cache_valid 60s;
    open_file_cache_min_uses 2;

    # Timeouts and uploaded file size
    keepalive_timeout 30;
    client_max_body_size 64m;
}
After changes, always check the configuration before restarting:
nginx -t && systemctl reload nginx
Important: do not copy parameters into the configuration without checking the context.
The worker_processes, events, gzip, tcp_nopush, and open_file_cache directives belong to different Nginx configuration levels. If they are placed in the wrong block, Nginx will not apply the settings or will fail to start after reload. Before making changes, create a backup copy of the configuration and always run nginx -t.
Please note: Database optimization is better performed after diagnosing the web server and PHP. Otherwise, you may change MySQL parameters without understanding whether the database is actually creating the load. You can review recommendations and practical approaches to database optimization in our article.
PHP Optimization
PHP performance directly affects website loading speed and server load. If PHP runs in an inefficient mode, consumes too much memory, or uses unnecessary extensions, even a simple website can create increased CPU and RAM load. Below are basic steps that will help reduce resource consumption, speed up request processing, and make the website more stable.
Switch to PHP-FPM
PHP-FPM (FastCGI Process Manager) works as a separate service and handles PHP requests more efficiently than built-in mod_php in Apache.
In ISPmanager 6, this is done through the interface: Sites → select the website → Settings → PHP-FPM. In cPanel, a similar setting is located in MultiPHP Manager.
Important: ISPmanager 4 may not have a built-in PHP-FPM setting in the panel interface.
Do not try to apply the ISPmanager 6 instruction directly: manually changing PHP, Apache, or Nginx configuration can disrupt websites and the panel itself. Before making changes, check the current PHP processing mode, create backup copies of configuration files, and use the documentation for your specific ISPmanager version.
Configure the PHP-FPM Pool for Your Server
nano /etc/php/8.1/fpm/pool.d/www.conf
For a VPS with 2–4 GB of RAM, the following configuration is recommended:
; Dynamic mode — creates processes as needed
pm = dynamic

; Maximum number of child processes
pm.max_children = 20

; Number of processes started at launch
pm.start_servers = 5

; Minimum number of idle processes
pm.min_spare_servers = 3

; Maximum number of idle processes
pm.max_spare_servers = 7

; Restart a process after N requests (helps prevent memory leaks)
pm.max_requests = 500
After changes, restart PHP-FPM:
systemctl restart php8.1-fpm
Disable Unused PHP Extensions
php -m
This command will show the list of loaded modules. If you see modules that your website definitely does not need, such as ldap, snmp, or xmlrpc, disable them — each module consumes memory.
ls /etc/php/8.1/fpm/conf.d/
Rename the configuration file of the unnecessary module by adding the .disabled suffix:
mv /etc/php/8.1/fpm/conf.d/20-ldap.ini /etc/php/8.1/fpm/conf.d/20-ldap.ini.disabled
Additionally: for correct and complete PHP optimization on the server, it is important not only to configure the PHP processing mode and the PHP-FPM pool, but also to correctly set parameters in the php.ini configuration file.
php.ini is used to configure memory limits, maximum script execution time, uploaded file size, module loading parameters, error handling, and other important settings that directly affect website stability and performance.
A detailed instruction on configuring PHP through php.ini is described in the article:
Configuring PHP.INI
Managing Processes and Autostart
A freshly installed server often has services running that no one intentionally enabled. Each service consumes RAM.
Check the List of Automatically Started Services
systemctl list-units --type=service --state=running

Disable What Is Not Needed
Examples of services that beginners often do not notice, but which consume resources:
# Postfix (mail server) — if you do not send mail directly from the server
systemctl disable postfix
systemctl stop postfix

# Bluetooth — definitely not needed on a server
systemctl disable bluetooth
systemctl stop bluetooth
Be careful: do not disable services whose purpose you do not know. If in doubt, it is better not to touch them.
Conclusion
Server performance optimization is not a one-time task, but an ongoing process. Start with monitoring to understand where the bottleneck is, then consistently apply the settings from this guide. Even partial implementation of the listed steps can significantly reduce website response time and improve stability under load.
If, after all optimizations, the server still lacks resources, it may be time to consider switching to a more powerful virtual server plan or expanding the hardware capabilities of the current physical server.


