4.5 Analysis of website performance issues

The purpose of this article is to provide a clear methodology for identifying bottlenecks in website performance on TheHost infrastructure. We will start with practical response speed measurements (in the browser and via the console), and then move on to deep diagnostics using CMS tools (using WordPress as an example) to compile a prioritized list of actions to accelerate your resource.
Note: before starting work, make sure you have fresh backups and, if possible, a staging environment. Some diagnostic modes (for example, SAVEQUERIES or extended logging) increase resource consumption and should be enabled briefly and consciously.
Speed Measurement
Website loading speed is not just a single number. To find the real bottleneck, it is practical to divide delays into two stages:
- Server response time (before HTML is delivered): delays on the application side (PHP), slow SQL queries, lack of caching, or long wait times for external APIs.
- Resource loading time (after HTML is delivered): delays on the browser side (Frontend). This includes loading “heavy” images, render-blocking scripts (JS/CSS), fonts, and third-party widgets. This phase is perfectly visible on the Network Waterfall chart.
Server Response Time Analysis (TTFB)
The first step in any diagnostic process is measuring TTFB (Time To First Byte). This is the time from sending a request to the moment the browser receives the first byte of data.
Note: for detailed information about what this metric is and what server factors it depends on, read our article: What is TTFB.
In this guide, we will jump straight into practice: below we will break down ways to measure TTFB using browser developer tools and the curl utility, and then, using CMS-level profiling (Query Monitor, logging), we will find the specific heavy scripts and queries that are slowing down page delivery.
Measuring TTFB in the browser
This method is needed for a quick initial measurement in conditions as close as possible to a real user, especially when there is no SSH access or you need to verify an issue from the client side. It shows TTFB in the browser context (including DNS/TLS/route and cache behavior), so it helps separate delays before HTML delivery (server/application) from problems that occur after HTML is received (resources/scripts/frontend dependencies).
- Open the site you are interested in in a browser. We recommend using Google Chrome or Mozilla Firefox.
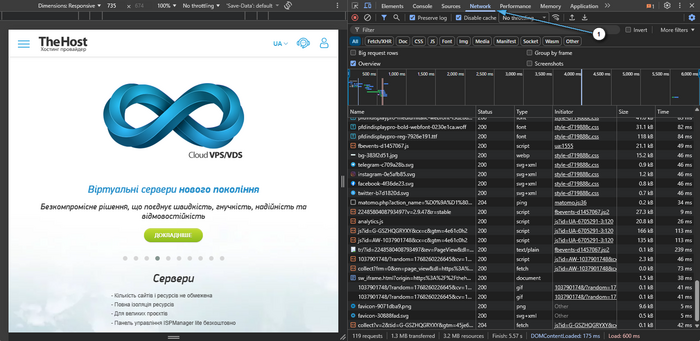
- Press F12 → Network.
-
Enable Disable cache (if available) and refresh the page (Ctrl+R).
-
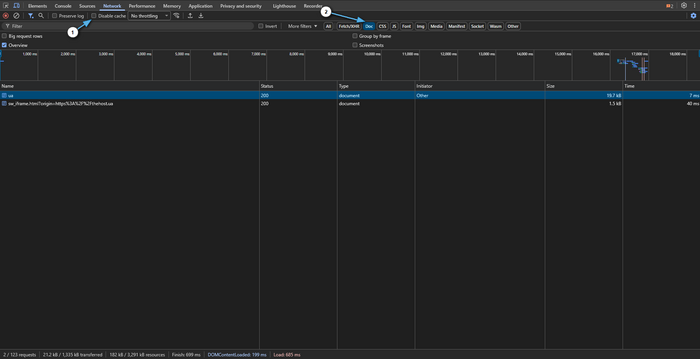
Select the top request of type Document (page HTML).
-
Go to the Timing tab and look at:
- Waiting for server response (TTFB) — time to the first byte (analog of
time_starttransferincurl).
- Waiting for server response (TTFB) — time to the first byte (analog of
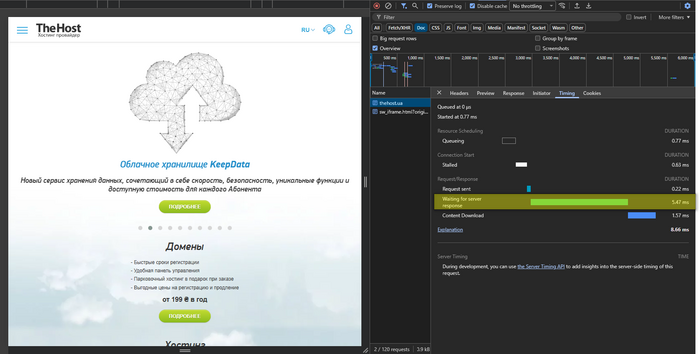
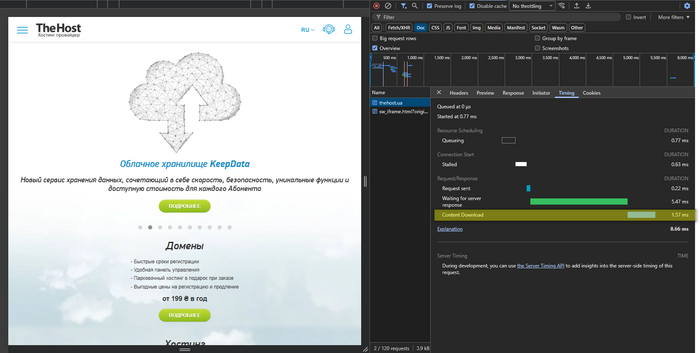
- Content Download — time to download the already generated HTML (analog of the value shown by
curl time_total, but only for HTML, without page resources).
Please note: Time reference points
The guidelines below are more correctly applied to a simple page without heavy personalization, provided that you do 2–3 measurements and look at the median:
- TTFB ~0.2–0.5s — usually fine.
- TTFB ~0.5–0.8s — borderline: depends on load, cache, and page logic.
- TTFB ~0.8–1.0s and above — a clear signal that the delay forms before HTML delivery (PHP scripts/SQL/cache/resources/external APIs).
Measuring TTFB using curl
This method is suitable for those who can run commands in a Linux console or whose service plan includes SSH access: it provides a “cleaner” measurement without the influence of extensions, client cache, and browser specifics.
curl -o /dev/null -s \
  -H 'Cache-Control: no-cache' -H 'Pragma: no-cache' \
  -w 'TTFB: %{time_starttransfer}\nTotal: %{time_total}\n' \
  https://SITE_DOMAIN/
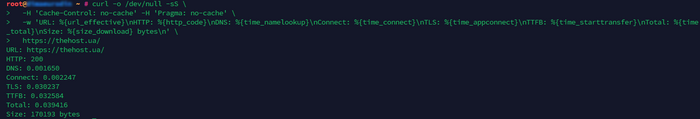
What the output means:
- TTFB (time_starttransfer) — time to the first byte (when the response started).
- Total (time_total) — total request time (including receiving the entire response).
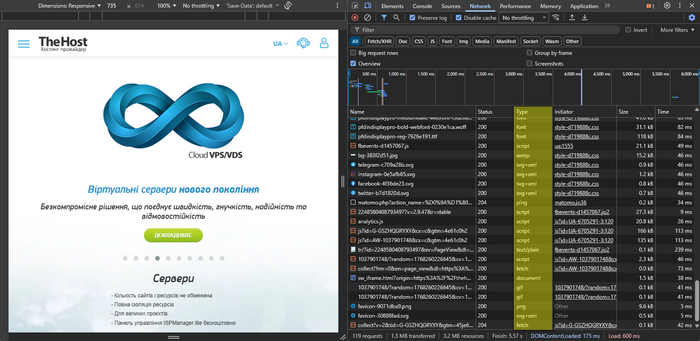
Detailed website speed measurement in the browser
After the HTML is received, the page loads resources (images, styles, scripts, fonts, API requests). The Network tab shows the list of requests and a timeline, which makes it clear what exactly takes time.
To take a measurement, perform the following steps:
- Open your website in a browser.
- Press F12 → Network.
- Check:
- Disable cache, to measure loading speed without the influence of the browser cache;
- if necessary, Preserve log, so the list of loaded resources is not cleared on each navigation.
- Refresh the page using Ctrl+R. You can also use Ctrl + F5.
Next, we describe the parameters you should pay attention to.
Overall view: which resource takes the most page load time
- Sort the Network tab contents by the Time (Time) and Size (Size) columns:
- Time — which requests take the most time.
- Size — what loads the most in terms of transferred data size.
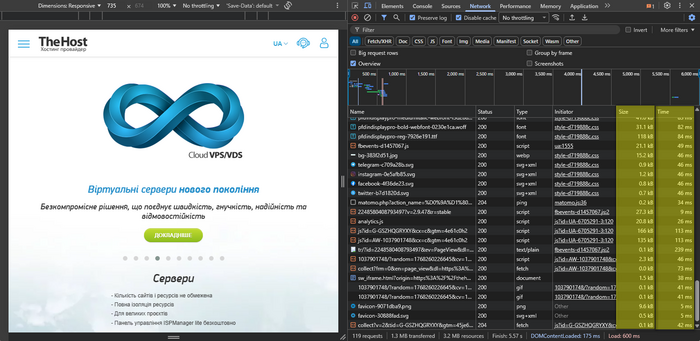
- Pay attention to types:
- Img — images.
- JS/CSS — scripts and styles.
- Font — fonts.
- XHR/Fetch — AJAX requests.
Waterfall: where pauses form
The waterfall in DevTools Network is a timeline of page resource loading (HTML, CSS, JS, images, fonts, etc.), where each request is shown as a separate bar with stages for waiting, establishing the connection, and transferring data. It shows which requests start early and which start late, how long they take, and where “idle windows” appear that make the page feel slow.
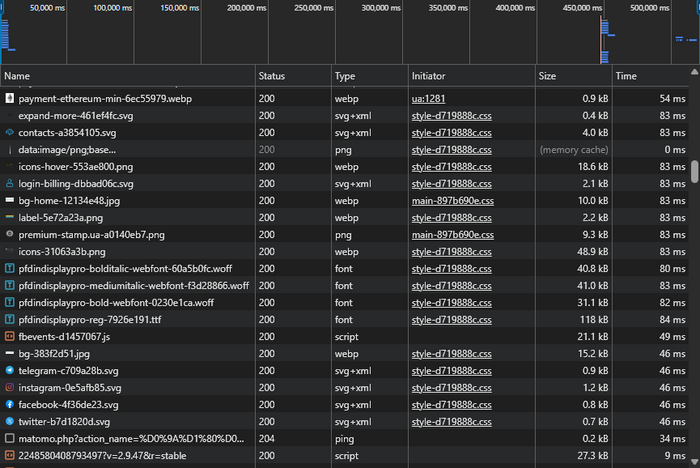
Typical signs:
- Long bars for large resources → large file size or slow delivery.
- Many resources start only after others → load dependency (blocking, late inclusion).
- A long pause before most requests start → loading begins late (often due to heavy JS or blocking resources).
“Chains” and blocking
Chains are situations where one resource cannot start loading or executing until another finishes—for example, a script that pulls in the next script, or styles that cause the browser to delay rendering. Blocking is a specific case of such dependencies: resources (more often JS/CSS or third-party widgets) delay critical stages, causing content to appear later even if the network and server are working normally.
Look for:
- A lot of JS/CSS loaded before rendering → delays content appearance.
- Third-party domains (analytics, chat, widgets) → often introduce noticeable delays.
- Repeated requests or many small files → increased overhead for downloading content.
Performance analysis using CMS tools
Important: performance analysis using CMS tools makes sense primarily when TTFB is consistently elevated — this is a sign that the delay is formed on the server side during HTML generation (PHP scripts/SQL/cache/external calls). Also, if XHR/Fetch (AJAX) or API endpoints are slow, they should be profiled within the application/CMS even if the main page TTFB is normal.
Profiling “inside” a CMS is diagnostics that shows where time is spent during page generation: which database queries are executed, which modules/plugins/components load the system, and whether there are external calls (APIs) that delay the response.
It’s important to set the right expectation: profiling does not speed up the site by itself. It provides facts that show what exactly slows down page generation and where it’s most beneficial to invest effort.
The practical goal is to find 1–3 key bottlenecks that account for the main share of the delay and most often directly increase TTFB.
To make results comparable, act like in a normal experiment: first record the baseline values, then change one factor at a time and re-check.
- Choose 2–4 control pages: homepage, category/catalog, product/post page, search, admin panel (if there are complaints about the admin).
- Perform baseline measurements: TTFB and loading behavior via Network (these steps are already covered above).
- Enable diagnostic modes briefly and record changes one by one: one change → one repeated measurement.
Please note: if you enable debug mode in parallel, change the theme, and update several plugins — the result will be unclear: you will see that something became better or worse, but you won’t understand why.
General analysis principles for any CMS
Regardless of the platform, profiling almost always comes down to three areas. It’s useful to keep them in mind because they help classify the problem and choose the next step faster.
1) SQL queries to the database
If the database returns data slowly, the page physically cannot be generated quickly.
- look for slow queries (roughly: > 0.1–0.5 seconds)
- look for duplicate queries (classic N+1 problem)
- check for indexes on frequently used fields
2) Application logic (PHP/Python/other languages)
Even with an optimized database, the site can be slow due to heavy business logic, template processing, complex filters, block generation, data imports.
- which modules/extensions/plugins are active
- which functions/handlers take the most time
- whether there are loops with a large number of iterations
- whether caching is used (page cache, object cache)
3) External dependencies
These delays are usually variable: fast today, slow tomorrow—because they depend on the network and third-party services.
- HTTP requests to third-party APIs (payments, analytics, integrations)
- connecting to external services (CDN, search indexes)
- license, update, statistics checks
Diagnostic tools
Next, the task is simple: find a data source that will show you SQL/time/modules/external requests.
Built-in CMS capabilities
Usually these are admin sections like Performance / Developer / Debug / Maintenance. Built-in debug mode often immediately shows part of the queries, execution time, and memory statistics.
Extensions and modules
If built-in tools are not enough, there are almost always profilers and debug panels. In extension catalogs, use search terms like: profiler, debug toolbar, query monitor, performance.
Environment-level logging
If UI tools are unavailable or inconvenient, logs are useful:
- PHP error log (configured in php.ini/control panel)
- application/CMS logs (if the admin has a separate logs section)
Example of website analysis based on WordPress CMS

WordPress is one of the most popular CMS platforms in the world, so it has a large number of stable and well-documented diagnostic and optimization tools. WordPress is convenient because it has reliable tools that show SQL, hooks, and external requests directly for the current page.
Query Monitor: the primary tool
Query Monitor is a plugin that adds a diagnostics panel and displays information about the current request directly in the admin panel.
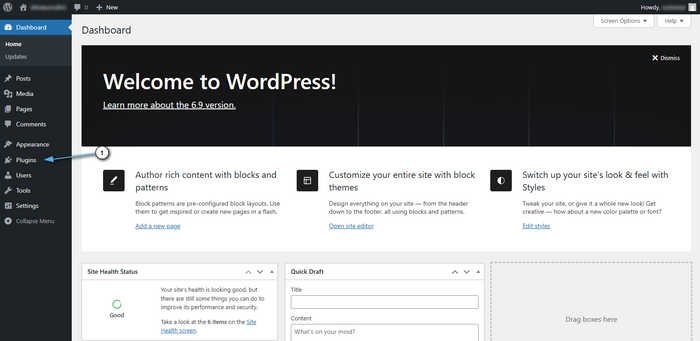
First, go to the plugins tab.
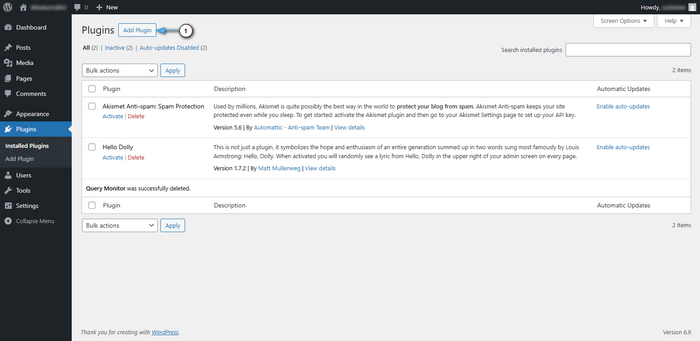
Click the button to add plugins.
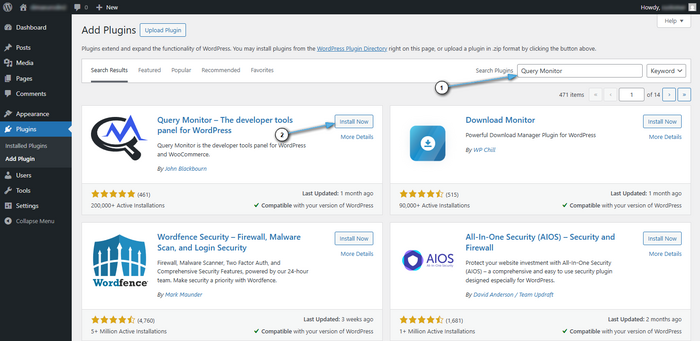
In the search field, enter Query Monitor. Once the search is complete, click the install button for the plugin.
First, open the problematic page and review the “three showcases”:
- SQL queries (Queries) — time, repetition, source (theme/plugin/function)
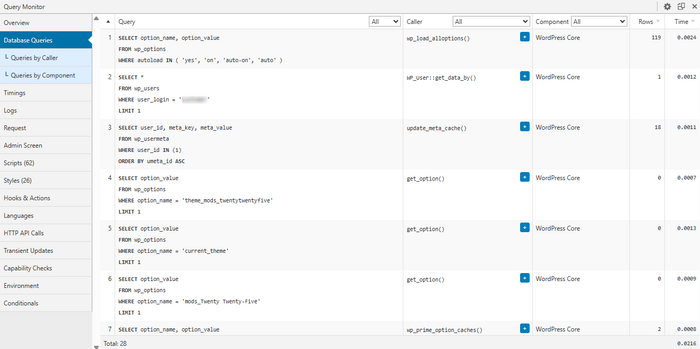
- Hooks & Actions — which hooks take the most time and who added them
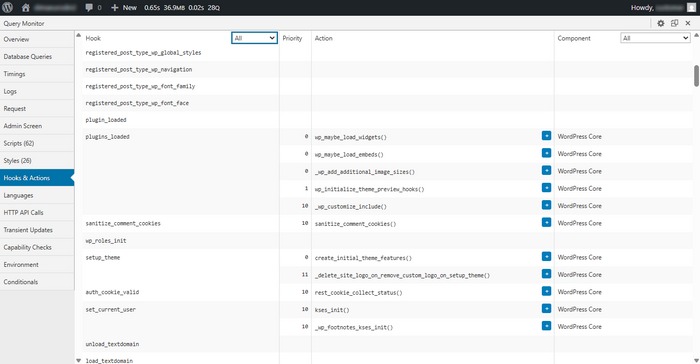
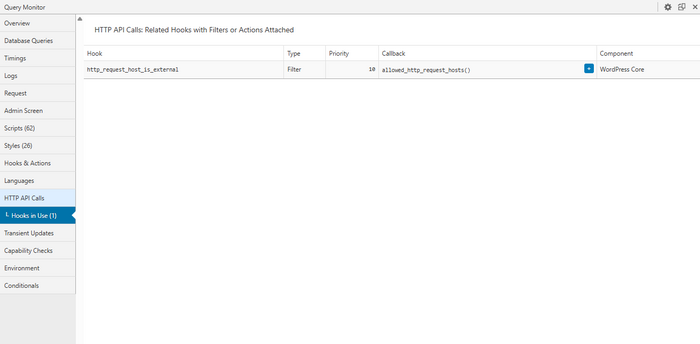
- HTTP API calls — external requests and their duration
Next, it’s important to immediately turn this review into a plan:
- List the 1–3 slowest/most frequent SQL queries and their source.
- List the 1–3 most expensive hooks or actions and who added them.
- List the 1–3 slowest external HTTP calls and where they go.
- Make one change (plugin/settings/cache) and repeat the measurement.
Diagnostics without plugins: built-in logging
If, for some reason, you cannot install plugins in your WordPress, you can briefly enable extended logging.
In wp-config.php, for the duration of diagnostics, set the following values:
define('WP_DEBUG', true);
define('WP_DEBUG_LOG', true);
define('WP_DEBUG_DISPLAY', false);
After that, log entries will be saved to wp-content/debug.log. This file is convenient to use as a “fact log,” especially if you add targeted error_log() calls near problematic areas.
SQL query logging is enabled separately and only for a short time:
define('SAVEQUERIES', true);
Important: SAVEQUERIES increases load and memory usage, so enable it briefly, collect data, and disable it.
Replace the current section block with the expanded version below (ready to paste). It explains where to add and how to use it.
Targeted micro-profiling in code
If you need to quickly estimate how long the request processing took overall (without function-level details), add minimal time measurements and write the result to the log. This is convenient for comparing “before/after”: disabled a plugin, enabled caching, changed a setting → refreshed the page → compared the times in the log.
Below are two practical approaches for where to place this code: via an MU-plugin (preferred, since it does not depend on the theme) and via the active theme’s functions.php (faster to deploy, but less reliable with updates/theme changes).
Option A (recommended): MU-plugin (theme-independent)
- Open the
wp-content/directory. - If the
mu-pluginsfolder does not exist, createwp-content/mu-plugins/. - Create a file, for example
wp-content/mu-plugins/request-timer.php. - Paste the code below. MU-plugins are loaded automatically; no activation in the admin panel is required.
<?php
add_action('init', function () {
  // Log only for admins to avoid unnecessary load and log volume
  if (!is_user_logged_in() || !current_user_can('manage_options')) {
    return;
  }
  $GLOBALS['t0'] = microtime(true);
}, 0);

add_action('shutdown', function () {
  if (!is_user_logged_in() || !current_user_can('manage_options')) {
    return;
  }

  $t = microtime(true) - ($GLOBALS['t0'] ?? microtime(true));
  error_log('WP request time: ' . $t . ' uri=' . ($_SERVER['REQUEST_URI'] ?? ''));
});
?>
Option B: functions.php of the installed theme
File: wp-content/themes/<your-theme>/functions.php (paste at the end of the file).
Downside: changes may be lost when switching or updating the theme.
<?php
// some code...

add_action('init', function () {
  // Log only for admins to avoid unnecessary load and log volume
  if (!is_user_logged_in() || !current_user_can('manage_options')) {
    return;
  }
  $GLOBALS['t0'] = microtime(true);
}, 0);

add_action('shutdown', function () {
  if (!is_user_logged_in() || !current_user_can('manage_options')) {
    return;
  }

  $t = microtime(true) - ($GLOBALS['t0'] ?? microtime(true));
  error_log('WP request time: ' . $t . ' uri=' . ($_SERVER['REQUEST_URI'] ?? ''));
});
?>
How to use (process)
- Select 2–4 control pages (homepage, category, product page, search, admin).
- Open each page 2–3 times, take baseline measurements by loading the measured page several times and calculating the arithmetic mean based on the log entries for its load time.
- Make one change (for example, disable a specific plugin).
- Repeat the measurement on the same pages and compare the values in the log.
This measurement reflects the execution time of the PHP/WordPress part on the server (approximately what affects TTFB), but it does not include browser resource loading.
To view the results, check:
- If
WP_DEBUG_LOGis enabled — thewp-content/debug.logfile. - Otherwise — the PHP/web server error log (depends on the environment).
Important: after diagnostics, remove the code (or the MU-plugin file) to avoid unnecessary logging and resource consumption.
Tip: When external tools are needed
If, while working with the CMS or your website, you see a problem but cannot determine what exactly and why it occurs (for example, you need a breakdown by functions/classes or deeper database analysis), external profilers and deeper monitoring are used. This most often requires a VPS/dedicated server and careful testing on a copy.
Use the task as a guide:
- need to see which function or method consumes time → language-level profiler (for example, Xdebug/Blackfire/Tideways)
- need to understand which queries became slow and why → advanced database diagnostics (slow query, statistics)
- need to understand why the server is slow overall → system monitoring (CPU/RAM/disk)
Specifics of analyzing other popular CMS platforms

Below are guidelines on where exactly to look for bottlenecks in typical CMS platforms and in what sequence this usually yields results fastest. The approach is universal: each system has different module names and entry points, but the diagnostic logic is the same — first you record client-side metrics, then confirm the causes on the server and CMS side. This is not a strict instruction, but a practical starting map that reduces initial analysis time and helps immediately highlight candidates for optimization. Additionally, keep in mind that caching, template processing, and plugins differ across CMS platforms, so it is useful to check not only speed, but also the conditions under which caching is not applied, as well as the contribution of extensions and integrations.
How to use this section correctly: first record TTFB and the loading picture in the browser, then enable diagnostics in the CMS only when there are signs of delays during HTML generation (high/unstable TTFB). For comparable results, choose 2–4 control pages and change one factor at a time.
Joomla
Built-in tools
Enable: System → Global Configuration → System → Debug System: YES. After that, Joomla can display SQL queries, memory usage, and execution time, as well as a list of loaded files/extensions.
What to pay attention to
- number and heaviness of modules on the page (especially if there are many modules in the template)
- caching (System → Global Configuration → System → Cache)
- compression and page cache settings
Drupal
Developer tools
Most often, the Devel module is used (query log, memory usage, execution time). For a detailed panel — Webprofiler (part of Devel).
What to pay attention to
- Views and their caching (a frequent source of heavy queries)
- number of active modules
- Twig and template compilation cache
OpenCart
How to approach diagnostics
If there is a developer/debug extension, use it (search the marketplace for debug/profiler). If there are no extensions, start with error logs and targeted measurements around problematic areas.
What to pay attention to
- number of modules/extensions on the page
- product/category queries (often N+1)
- third-party payment/shipping modules (external HTTP requests)
MODX, PrestaShop, and others
For other CMS platforms, the same algorithm almost always works:
- find debugging / performance sections in the official documentation
- check the marketplace/module catalog for profilers
- enable CMS-level logging and briefly collect data for 2–4 problematic pages
Above, we covered how to turn the subjective “the site is slow” into measurable facts: record TTFB (in the browser and via curl) and use the Network waterfall to determine where the delay is formed — before HTML delivery or after. If TTFB is elevated, the next step is to confirm the causes within the application/CMS (SQL, hooks/modules, external HTTP calls) and produce a list of specific optimization candidates. Below is a universal sequence of actions that helps you stay focused and quickly reach prioritized changes.
Reproducibility principle: record baseline measurements (2–3 measurements and the median), then change only one factor at a time and repeat the measurement on the same control pages. This protects against false conclusions and speeds up finding the real bottleneck.
Universal diagnostic checklist

The checklist helps you run diagnostics step by step: from measurements to causes, so you can quickly identify specific bottlenecks and prioritized actions.
Step 1: Baseline measurements
First, record client-side metrics:
- measure TTFB using the browser or
curl - check the resource loading sequence after receiving HTML (Network waterfall)
Step 2: Enable CMS debug mode
Next, enable diagnostics on the CMS/application side:
- activate built-in debug/developer mode or connect a profiler
- collect data on pre-selected control pages
Step 3: Build a list of the main delay sources
Translate the problem into concrete candidates:
- 3 slowest SQL queries
- 3 most resource-intensive modules/components/plugins
- external HTTP requests (if any) with their durations
Step 4: Verify caching and cache-miss reasons
It’s important to assess not only whether caching exists, but also the conditions under which it is not applied:
- whether page cache is active
- whether object cache and query cache are active, if supported by the CMS
- whether there are factors that lead to frequent misses or resets (dynamic blocks, authentication, frequent updates, differing cookies/headers)
Step 5: Prioritize and validate the impact
- start with the change with the highest expected impact
- after each change, repeat the measurement and compare with the baseline
Conclusion
You now have a reproducible measurement baseline: TTFB (via DevTools and curl) and an understanding of where the delay is formed — before HTML delivery (application logic, SQL, caching, external HTTP calls) or after (page resources, fonts, third-party scripts, number of requests). This turns a subjective “slow” into specific metrics that you can improve step by step and validate with numbers.
Next steps depend on which layer requires optimization. For practical scenarios, continue with one of the following articles:
- Performance optimization on Hosting services — if you need to focus on CMS settings, caching, reducing “heavy” plugins/modules, and optimizing page resources.
- Optimization on VPS/VDS, Dedicated services — if you are ready to dive deeper into server environment tuning (web server, PHP-FPM, OPcache), background task control, and system monitoring.
- Database optimization — if diagnostics show that most time is spent in SQL: slow queries, repeated selects, indexes, and locks.
It is recommended to keep a “baseline line” of metrics and repeat measurements after each change: this way you improve performance predictably and can confirm the effect with measurements.

