8.2.1 Server Resource Monitoring Setup with Netdata
 Netdata is a free, open-source solution for monitoring system performance and status, available for Linux, macOS, and FreeBSD. It collects server metrics in real-time and displays them visually through a web interface. With Netdata, you can track key VPS resource indicators: RAM usage, CPU load, network traffic, disk space usage, and much more. This article covers the installation of Netdata using Ubuntu 22.04 LTS as an example, basic configuration for monitoring core resources, as well as setting up alert notifications via Email and Telegram. In conclusion, an optional section is provided on how to connect multiple servers to Netdata Cloud for centralized monitoring.
Before installation, make sure that:
Installing Netdata on Ubuntu
We’ll install Netdata from the Ubuntu repository.
- Update the system and install cURL.
sudo apt update
sudo apt install curl -y
- Run the automatic Netdata installation script.
The official script will automatically determine the optimal installation method and deploy Netdata on your system.
sudo bash <(curl -SsL https://my-netdata.io/kickstart.sh)

Wait for the script to complete – it will download all necessary components and start Netdata as a service. You should see a message about the successful installation of Netdata in the script output. The script will also automatically enable daily Netdata auto-updates via cron.
- Verify that the Netdata service is running.
After installation, the Netdata service should start automatically. You can check the service status with the following command:
sudo systemctl status netdata

You should see that the netdata.service is in the active (running) state.
If the service is not running, start it manually:
sudo systemctl start netdata
If you’re using UFW
Open port 19999. By default, the Netdata web interface runs on port 19999. If a firewall is activated in the system (e.g., UFW), open this port for incoming connections:
sudo ufw allow 19999/tcp

Make sure the rule has been applied and the UFW status is active by running:
sudo ufw status

If you’re using iptables directly
You can add a rule with the following command:
sudo iptables -A INPUT -p tcp --dport 19999 -j ACCEPT
To save the rules after a reboot, execute:
sudo apt install iptables-persistent
sudo netfilter-persistent save
Accessing the Netdata Web Interface
After successful installation, navigate to the Netdata web interface to view metrics:
Open a browser (from any location with access to your VPS) and enter in the address bar: http://<Your server's IP address>:19999.
For example: http://123.45.67.89:19999 (replace with your VPS’s actual IP). If you’re installing Netdata on a local machine, you can use http://localhost:19999.

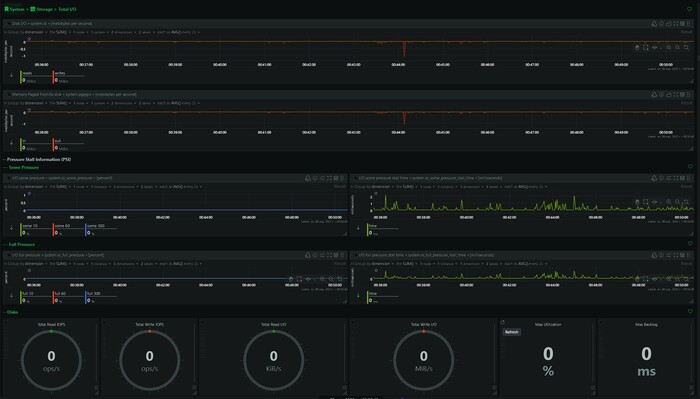
The Netdata monitoring dashboard will appear – an interactive web interface with graphs that update every second. You should see the Netdata dashboard with a list of system metrics (an example of the interface is shown in the screenshot below).

Core Monitoring Metrics
The Netdata dashboard displays dozens of metrics by default, structured by categories. Below are the key VPS resources that Netdata monitors:
- Processor (CPU): real-time CPU usage (in percentages by core and total), average load, number of running processes, and CPU time streams (user, system, iowait, etc.). These indicators allow you to track how loaded the processor is and whether there is constant 100% usage.

- Random Access Memory (RAM): amount of used and free memory, cache, and buffers. Netdata shows a RAM usage graph, which helps notice memory leaks or memory shortages (for example, if there is little free memory and the system starts actively using swap). Swap metrics (page file) are also displayed if configured.

- Disk and File System: amount of used and free disk space on each partition, as well as disk subsystem performance – read/write speed (in bytes per second), number of input/output operations (IOPS). By tracking this data, you can see when a disk is full or when intensive I/O operations are occurring, affecting performance. Netdata can also warn about low free disk space.
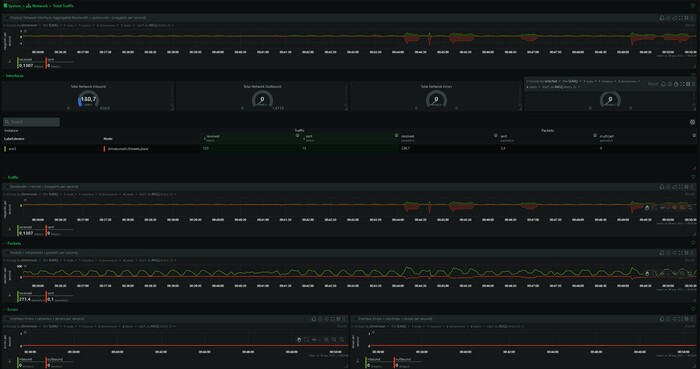
- Network Traffic: statistics on network interfaces – incoming and outgoing speed (bytes/s), number of packets, errors, and packet drops. This allows you to control network load, detect abnormally high traffic, or network problems.
- Other Metrics: Netdata automatically collects many additional data points: system load (Load Average), system uptime, CPU usage by individual processes, number of file descriptors, CPU temperature (if available), etc. Additionally, Netdata has a plugin architecture and recognizes many services (such as MySQL, Nginx, Docker, etc.) – if they are present on the server, corresponding sections with their metrics will appear in the interface. No additional configuration is required for basic VPS monitoring – Netdata starts tracking all key system indicators “out of the box.”
Each graph in Netdata is interactive: you can hover over it for exact values, browse historical data, and scale the time range. Updates happen in real-time, allowing you to observe the system’s immediate reaction to load (for example, a sharp spike in CPU load when starting a task).
Setting Up Notifications
Email Notifications
For sending email notifications, Netdata uses a local mail server (MTA). This means that your VPS must have a mail sending service configured (such as Postfix or Sendmail). If you don’t already have an MTA, install, for example, Postfix with the command sudo apt install postfix -y and during the initial setup, select the “Internet Site” type (so the server can send mail directly). Make sure the system is capable of sending emails externally (for example, with the command echo "Test" | mail -s Test you@example.com if the mailx utility is available).
Next, we’ll configure Netdata for email notifications:
- Open the notifications configuration file.
The main notification parameters are in the file /etc/netdata/health_alarm_notify.conf. Open it as a superuser in a text editor:
sudo nano /etc/netdata/health_alarm_notify.conf
- The
health_alarm_notify.conffile is used by the Netdata notification script. It specifies settings for each notification method, as well as recipients by role.
- Find the email settings section.
The file contains comments and examples. Find the block containing the lines # email global notification options. In this section, edit or uncomment the following parameters:
# Email global notification options
SEND_EMAIL="YES"
DEFAULT_RECIPIENT_EMAIL="you@example.com"
EMAIL_SENDER="Netdata <netdata@your-domain>"
- SEND_EMAIL=“YES” – enables sending notifications by email.
- DEFAULT_RECIPIENT_EMAIL – specify the address to which emails will be sent (replace you@example.com with your email);
- EMAIL_SENDER – optional, sets the sender address for emails. By default, the sender will be [email protected] (or another system one), but you can specify your own address/name for convenience.
Save the changes to the file (in the Nano editor, press Ctrl+O, Enter, and Ctrl+X to exit).
- Set recipients for roles (optional).
Netdata groups alerts by roles (for example, sysadmin, dbadmin, etc. – they are specified in the configuration of each alert). By default, all main system alerts belong to the sysadmin role. If you haven’t configured anything special, it’s enough to specify the default email, as done above – then all alerts for sysadmin will go to DEFAULT_RECIPIENT_EMAIL. If necessary, you can set different addresses for different roles by editing lines like role_recipients_email[<role>]=“…” at the bottom of health_alarm_notify.conf (but for starters, you can leave it as is).
- Restart Netdata.
For the new settings to take effect, restart the Netdata service:
sudo systemctl restart netdata
Now Netdata will send an email to the specified address when a problem occurs. Make sure the emails don’t go to spam. By default, Netdata is configured to send emails if the MTA on the system is set up correctly.
Example:
Netdata will start sending email notifications if RAM usage on the server exceeds the critical threshold of ~90% for a specified time, and similarly for other resources (CPU, disk, etc.) – all these thresholds are set in the default configuration. You will receive an email with a subject containing the hostname and problem description, as well as metric details in the body, for example:
[Netdata] WARNING on myserver: system.ram – system memory utilization"
Tip:
To test notification sending yourself, Netdata provides the alarm-notify.sh script. You can run it manually under the netdata user for verification. For example, execute:
sudo su -s /bin/bash netdata
export NETDATA_ALARM_NOTIFY_DEBUG=1
/usr/libexec/netdata/plugins.d/alarm-notify.sh test
This command will generate test notifications across all enabled channels (email, Telegram, etc.) for the sysadmin role. Check if you received the test email.
Telegram Notifications
Sending notifications via Telegram is a convenient way to instantly receive alerts on your phone or computer. Netdata can directly send messages via a Telegram bot. To set this up, you need to complete several steps:
Learn more about how to set up a Telegram bot in our article.
- Create a bot in Telegram and get a token.
Open a dialog with the official @BotFather bot in the Telegram app. Send the /newbot command and follow the instructions – create a name for your bot and its username. Eventually, BotFather will give you an API token for your bot (a string of characters like 123456789:ABCDEF…). Save this token.
- Find your Chat ID in Telegram.
If you plan to receive notifications personally in private messages from the bot, you need to know your chat identifier (the numerical ID of your Telegram account). The easiest way is to message the @myidbot bot with the /getid command – it will respond with your personal ID. If you want to send notifications to a group chat, add your bot to the desired group and also find out its ID (for example, by adding the @myidbot bot to the group and executing /getgroupid there). Group identifiers usually start with -100….
For simplicity, let’s assume you’re sending notifications to yourself personally – you have a user ID (for example, your_id).
- Edit the Netdata notification configuration for Telegram.
Open the /etc/netdata/health_alarm_notify.conf file (as described earlier) and find the # telegram settings section. Set the following parameters (uncomment them if necessary and fill in the values):
# Telegram global notification options
SEND_TELEGRAM="YES"
TELEGRAM_BOT_TOKEN="123456789:ABCDEF_your_bot_token_here"
DEFAULT_RECIPIENT_TELEGRAM="your_id"
- SEND_TELEGRAM=“YES” – enables sending notifications through Telegram;
- TELEGRAM_BOT_TOKEN – insert your bot token received from BotFather here. Important: keep the token secret, like a password;
- DEFAULT_RECIPIENT_TELEGRAM – specify the recipient’s Chat ID here. If you’re sending to yourself, this is your user ID (for example, 123456789). If the bot should write to a group, specify the group ID (for example, -100987654321).
Save the changes to the configuration file.
-
Restart the Netdata service:
sudo systemctl restart netdatato apply the new settings. -
Start the bot (if necessary). If you plan to receive messages personally, simply send any message to your bot (for example,
/start) to open a dialog with it. For a group – make sure the bot is added to the group.
After this, Netdata will send messages to Telegram when alerts trigger. The message format includes the problem level (WARNING/CRITICAL), hostname, metric name, and current value. For example, you might receive a message like:
“Netdata [CRITICAL] myserver system.cpu for 1m: CPU Utilization = 95%”
Checking and Managing Alerts
After setting up notifications, it makes sense to familiarize yourself with the triggering thresholds of the main alerts. All of them are described in configuration files in the /etc/netdata/health.d/ directory (for example, cpu.conf, ram.conf, etc.). By default, thresholds are chosen conservatively – for example, a CPU warning triggers at >80% load (critical at >90%), for memory – at >90% usage, for disk space – at >90% fill, etc. If necessary, you can customize these thresholds to your requirements by editing the corresponding .conf files (or through the convenient GUI alert configurator in Netdata Cloud itself).
To temporarily disable all notifications (for example, during server maintenance), you can use “Silent mode” (Silence): in the Netdata web interface, click the bell icon and select how long to suppress alerts.
Information: For additional information, you can use the official resources:

