6.4.5 How to identify what is causing the load on a UNIX server
Note: This article is primarily intended for virtual and dedicated servers where you have administrator (root) privileges.

Identifying the Load on Unix Servers
To start the task, you need to connect to the server first using the SSH protocol. Diagnosing server load on Linux involves analyzing various parameters and system resources.
Main diagnostic criteria: include analyzing the average load on the processor and memory, evaluating input-output (I/O), and information about active processes. These parameters allow for effective problem detection and resource optimization for improved server performance
Let’s take a closer look:
1. CPU Load:
- Check CPU usage percentage using utilities like
top,htop,atop. - Identify processes that consume the most CPU.
2. Memory Usage (RAM):
- Analyze memory usage with the
freecommand or utilities liketop,htop,atop. - Identify processes that consume a lot of memory.
3. Disk I/O Usage:
- Check disk activity using utilities like
iotop,iostat. - Identify processes creating high disk load.
4. Network I/O Usage:
- Monitor network traffic with tools like
iftop,nload, or network monitoring utilities. - Identify processes generating high network traffic.
5. System Logs and Journals:
- View system logs (
/var/log/messages,/var/log/syslog) for errors or warnings. - Analyze the output of the system event journal (
journalctl).
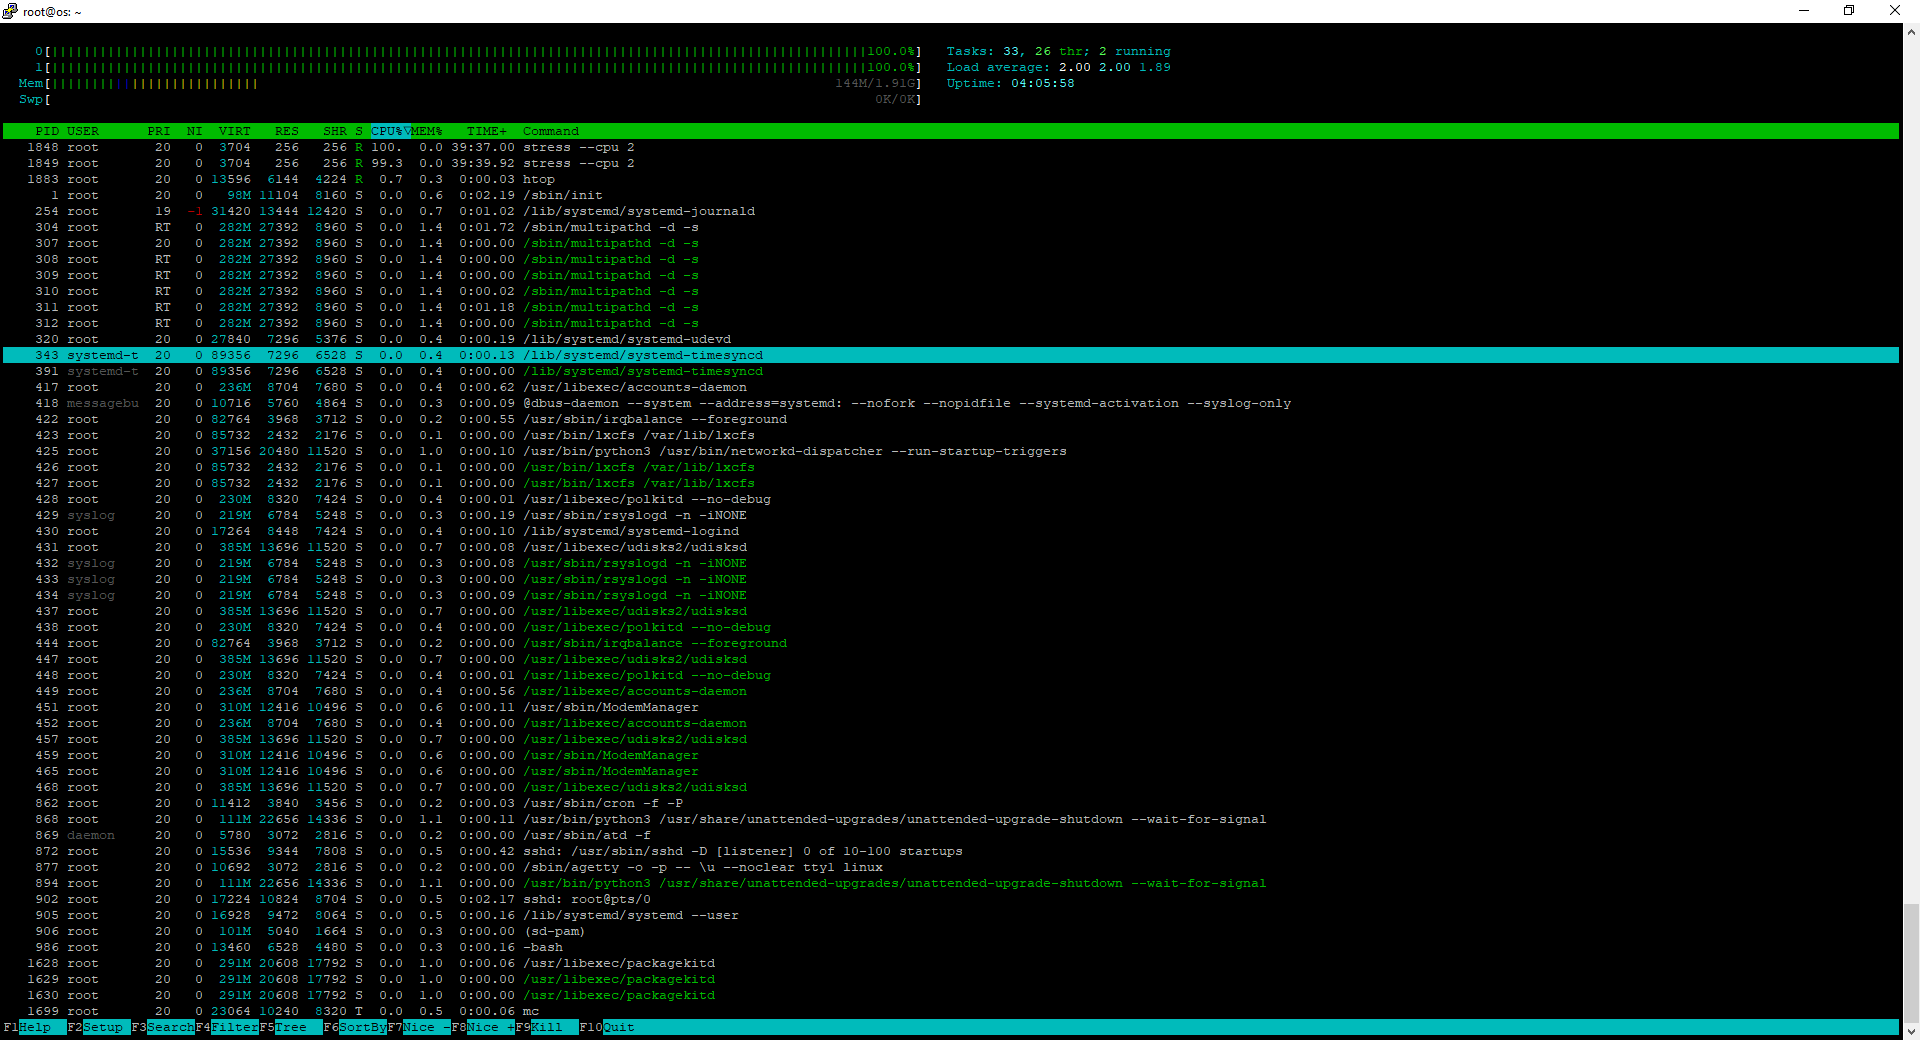
Load Diagnostics Using the top
The top utility in Linux provides an efficient way to monitor and diagnose system load in real time. Let’s consider the main components of its interface, which help quickly identify problems and optimize the use of resources.
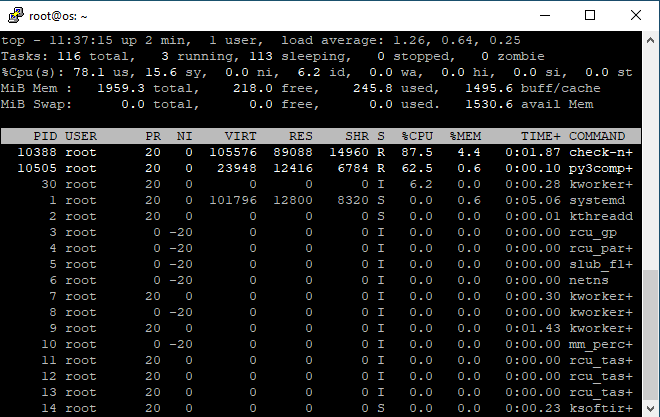
The top utility interface is divided into two main parts:
Upper part: monitoring of the current load on the system, which includes the following indicators
1. Load Average:
-
Three values for the last 1, 5 and 15 minutes. High values may indicate system overload.
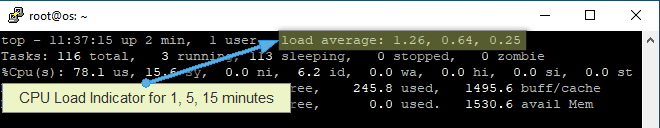
-
Normal load is an indicator that is lower than or equal to the value of the number of cores.
-
You can check the number of processor cores on the server with the
nprocutility
- root@os ~ # nproc
- 2
2. Usage (CPU):
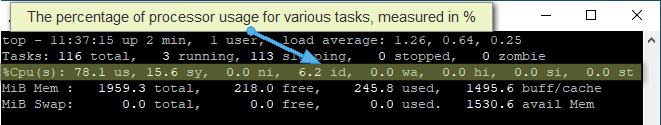
The CPU line shows how actively the processor is being used. All values are measured in percentages and allow you to estimate how much time the processor spends on different types of tasks. The string has the following parameters:
| Name: | Meaning: |
|---|---|
| %Cpu(s) | The total percentage of time during which the processor is busy performing various tasks. |
| us (User) | The percentage of time during which the processor spends performing tasks from the user, for example, applications. |
| sy (System) | The percentage of time during which the processor spends performing system tasks related to the core of the operating system. |
| ni (Nice) | Percentage of time during which the processor performs tasks with a reduced priority (nice). |
| id (Idle) | The percentage of time during which the processor is idle and does no tasks. |
| wa (Wait) | The percentage of time that the processor waits for input/output (I/O) operations to complete. |
| hi (Hardware Interrupts) | The percentage of time the processor handles hardware interrupts. |
| si (Software Interrupts) | The percentage of time the processor handles program interrupts. |
| st (Steal Time) | The percentage of time that the virtual machine loses CPU access due to the actions of other virtual machines. |
3. Memory usage (Memory):
The memory usage line contains information about the current state of RAM. Here’s what’s usually included in that line:
| Name: | Meaning: |
|---|---|
| total | The total amount of RAM in the system. |
| used | The amount of RAM used. |
| free | The amount of free RAM available for use. |
| shared | The amount of memory used by shared processes. |
| buff/cache | Amount of memory used for buffers and cache. Buffers store data before writing to disk, while the cache contains cached data for faster access. |
| available | The total amount of memory available for new processes without using paging. |
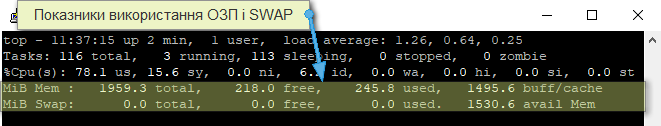
These values are measured in kilobytes (KB), megabytes (MB), or gigabytes (GB), depending on the current memory load on the system. The information in this line helps to assess how efficiently the RAM is being used and whether there is a need for additional resources.
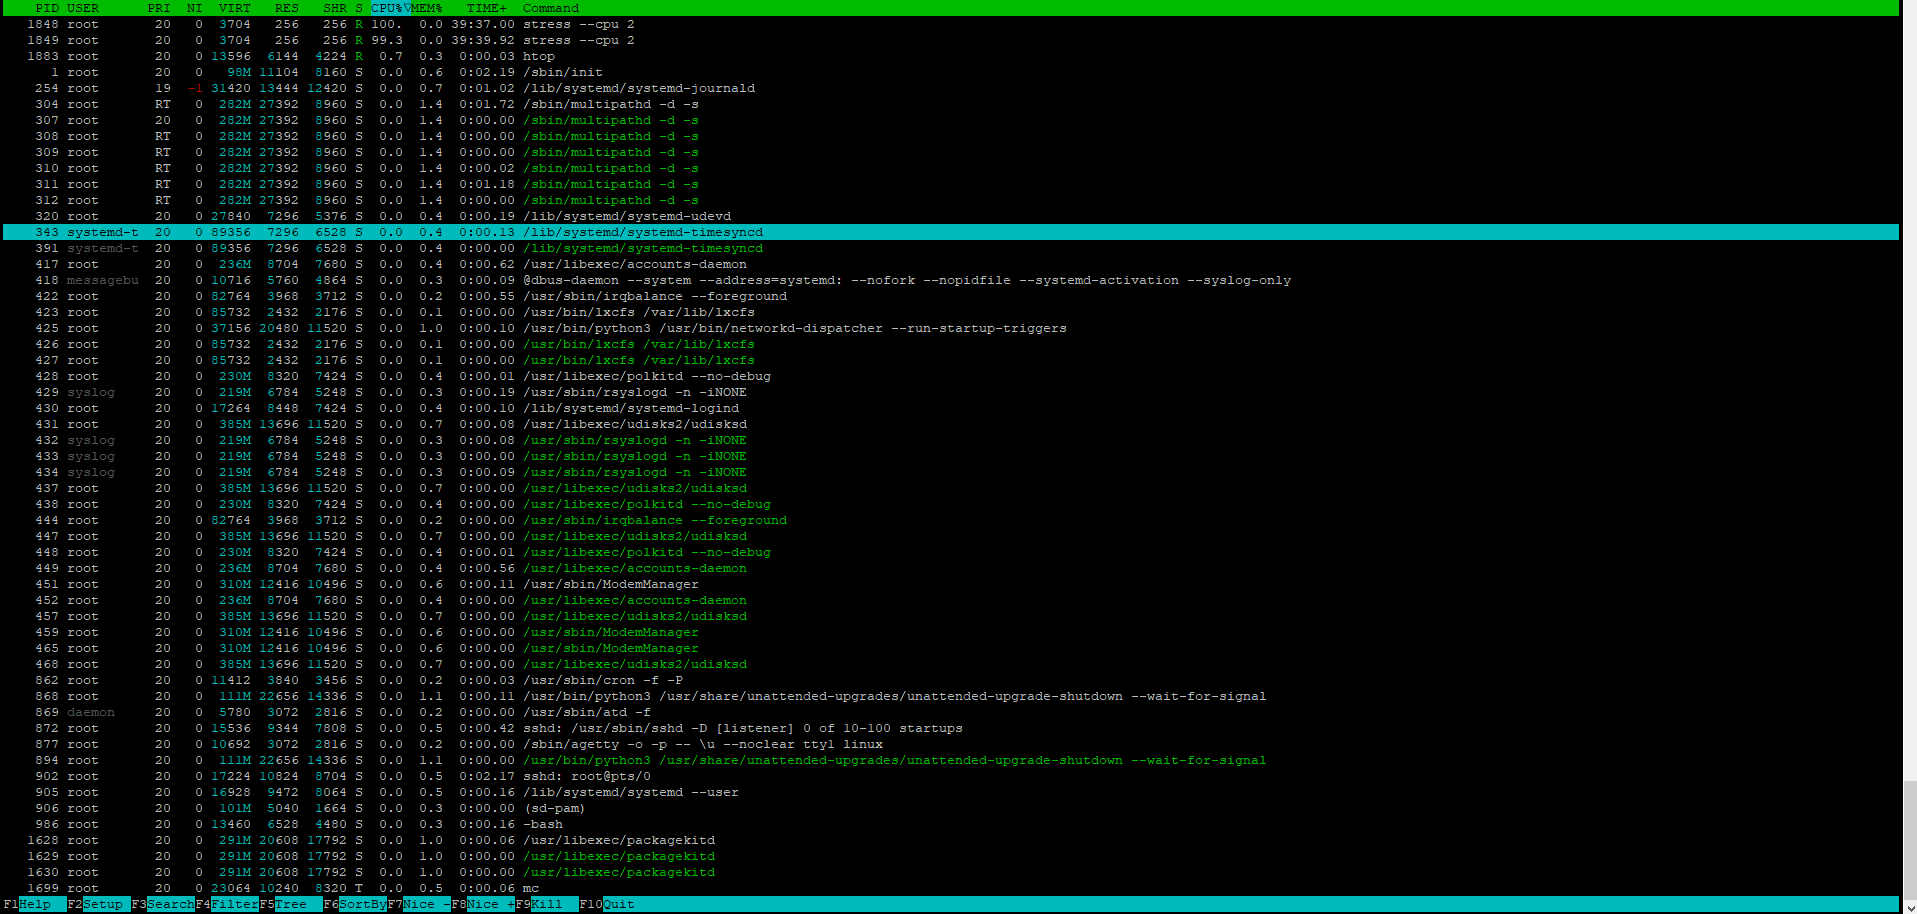
Bottom part: contains a table that displays detailed information about current processes
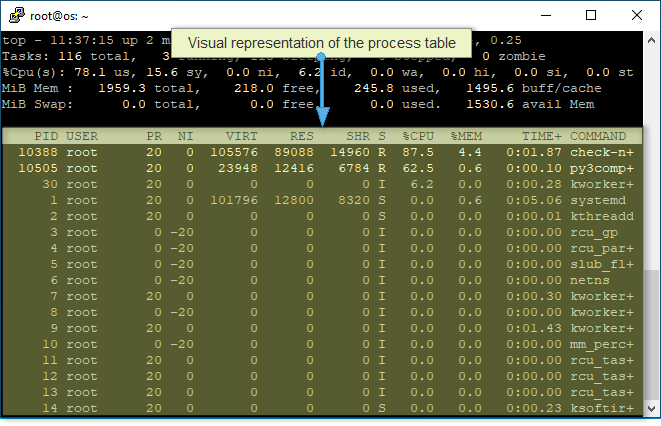
Each row of the table contains the following fields:
| Name: | Meaning: |
|---|---|
| PID (Process Identifier) | A unique numeric identifier for each process. The process can be uniquely identified by this identifier. |
| USER | The name of the user who started the process. This allows you to determine who owns the process. |
| PR (Priority) | Process priority. The lower the value, the higher the priority. For example, 20 is the lowest priority, -20 is the highest. |
| NI (Nice) | Process priority as a “nice” value. This is a number that shows how “friendly” the process is. Positive or negative values affect the priority. |
| VIRT (Virtual Memory) | The total amount of virtual memory used by the process. |
| RES (Physical Memory) | The amount of physical memory used by the process. |
| SHR (Shared Memory) | The amount of memory shared between multiple processes. |
| S (Status) | The current status of the process. For example, “R” means that the process is running (running), “S” means that it is in standby mode (sleeping). |
| %CPU (CPU Usage) | Percentage of CPU usage by this process. |
| %MEM (Memory Usage) | The percentage of RAM used by the process. |
| TIME+ (CPU Time) | The total amount of CPU time spent executing the process. |
| COMMAND | A command or file launched by a process. |
Various key combinations are available to manage the process table, here are the most necessary ones:
| Command: | Description: |
|---|---|
k (Kill) |
Kill (terminate) the selected process. Enter the process PID and press Enter. |
r (Renice) |
Change the priority (nice value) of the selected process. Enter the PID and new priority, then press Enter. |
u (User Filter) |
Display only processes started by a specific user. Enter your username and press Enter. |
M (Sort by Memory Usage) |
Sort processes by memory usage (descending). |
P (Sort by CPU Usage) |
Sort processes by CPU usage (descending). |
F (Choose Fields) |
Selecting which fields to display in the process table. |
Space (Toggle Process Selection) |
Select/unselect one or more processes. |
Enter (Select Field for Sorting) |
Selecting a field for sorting processes. |
W (Write Configuration to File) |
Save the current configuration to a file for later use. |
q (Quit) |
Exit the top utility. |
Checking the load with atop
The atop utility in Linux provides detailed information about system load and resources in real time. Let’s consider the main components of its interface, which help quickly identify problems and optimize the use of resources.
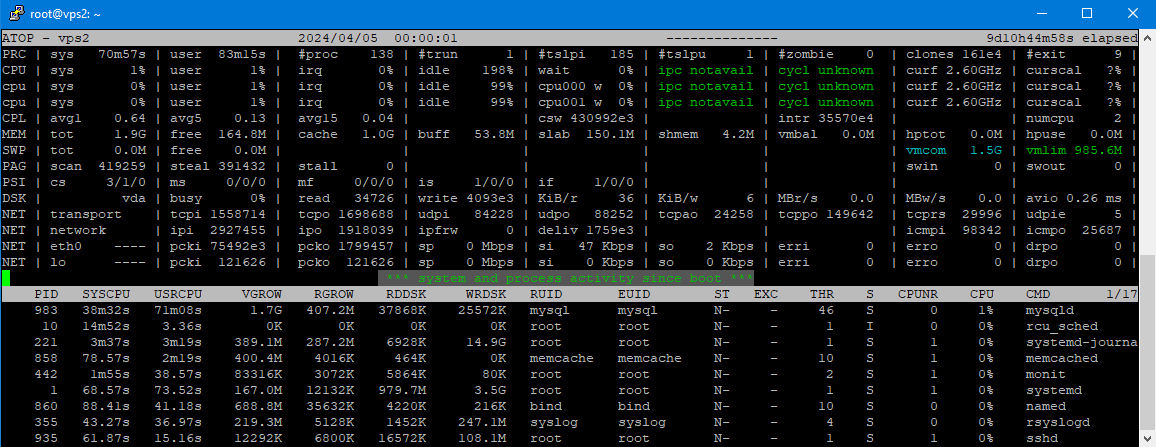
The interface of the atop utility is divided into several sections that provide information about the system load:
Upper part: general information about the load on the system
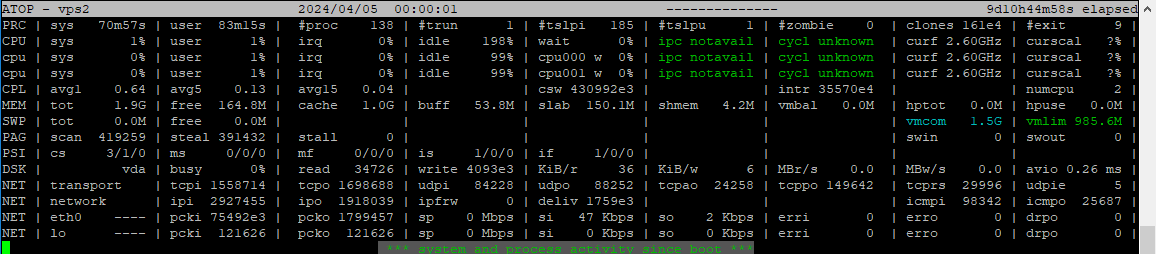
| Name: | Value: |
|---|---|
| Time and Duration of Work | Displays the current time and system uptime. |
| Number of Users | Shows the number of active users on the system. |
| System Load | Displays the current system load, including average CPU load and number of processes. |
| CPU Statistics | Provides information about the load on each CPU core. |
| Memory Statistics | Displays memory usage and swap space utilization. |
| Disk Statistics | Shows disk subsystem activity. |
| Network Statistics | Displays network activity, including the amount of data sent and received. |
| Input/Output Statistics | Provides information about input/output operations on disk devices. |
| Network Connection Statistics | Shows active network connections and their characteristics, such as IP addresses and used ports. |
Bottom part: contains detailed information about the processes running in the system
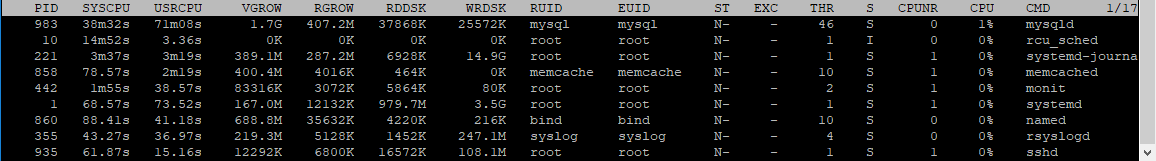
| Name: | Value: |
|---|---|
| Process List | Provides a list of all processes in the system with their characteristics, such as process identifier, username, CPU and memory usage, status, etc. |
| Management Commands | Provides access to management commands for the process table, such as killing a process, changing priority, sorting, and filtering processes. |
The utility allows you to view logs for today, for this type:
- atop -r
Useful keys:
t- go forward in time.Shift + t- go back in time.
To view the system load history for previous days in the atop utility, you can use the -r option (replay mode) in combination with specifying a specific date.
- atop -r YYYYMMDD
Where YYYYMMDD is the date in YYYYMMDD format, which is the day for which you want to view the load history. For example, 20240405 for April 5, 2024.
- atop -r /var/log/atop/atop_20240405
- Use the up and down arrow keys to scroll up and down the screen.
- To move forward and backward in time, use
tandShift+tkeys. - You can use the left and right arrow keys to scroll through the data faster or slower.
- To exit playback mode, press the
qkey.
Additional: list of available key combinations
q- Exits the atop utility.r- Changing the process sorting mode (by CPU, memory and other criteria).b- Switch between sorting modes (descending or ascending).s- Change the interval between screen updates (increase or decrease).i- Enable or disable interactive mode (search and filtering).n- Switch between modes for displaying network activity (bytes or packets).m- Switch between memory usage display modes (various metrics).p- Switch between CPU load display modes (all, only system or only user processes).j- Switch between I/O control display modes (all, read only or write only).o- Turn on or off the display mode of delayed entries (writeback).x- Enable or disable the display of high priority processes (RT).L- Turn on or off the mode of displaying blocked processes.C- Turn on or off the display mode of process commands.A- Switch between display modes of all or active processes.I- Enable or disable the mode for displaying system process identifiers.N- Switch between display modes of port numbers or service names for network activity.W- Save current atop settings to a file.?- Displays help on key combinations.
Load Diagnostics Using the htop
The htop utility is an interactive monitoring utility for real-time system diagnostics on Linux operating systems. It provides a more convenient and interactive way to diagnose a system than the classic top utility, and can be a useful tool for system administrators and developers.
The interface of the htop utility is divided into two main parts
Top part: monitoring the load on the system in real time, let’s look at each element separately
| Name: | Meaning: |
|---|---|
| General Loading | Three values for the last 1, 5 and 15 minutes. High values may indicate system overload. |
| Number of cores | Number of physical and logical processor cores. |
| CPU Usage | Graphic display of the activity of each processor core. |
| Memory Usage | Graphic indication of RAM usage. |
| List of options and commands | Information about the available keys for controlling and interacting with the utility. |
| Column headers | Explanation of the values in the top row of the process table. |
Bottom part: contains a table that displays information about processes, let’s look at each element separately
| Name: | Meaning: |
|---|---|
| PID (Process Identifier) | A unique number identifying the process. |
| USER | The name of the user under which the process is running. |
| PR (Priority) | Process priority. |
| NI (Nice) | Process priority as a “nice” value. |
| VIRT (Virtual Memory) | The total amount of virtual memory used by the process. |
| RES (Physical Memory) | The amount of physical memory used by the process. |
| SHR (Shared Memory) | The amount of memory shared between processes. |
| S (Status) | The current status of the process (for example, running, idle). |
| %CPU (CPU Usage) | The percentage of CPU used by this process. |
| %MEM (Memory Usage) | The percentage of RAM used by the process. |
| TIME+ (CPU time) | The total amount of CPU time spent executing a process. |
| COMMAND | A command or executable file launched by a process. |
Diagnosing CPU Load Using the ps Utility
To monitor the load on the processor, you can use the ps utility. The utility provides a lot of information about running processes in the Linux operating system. One way to track CPU usage is to use a combination of options, including sorting by CPU usage. Let’s look at the command:
- ps -aux --sort -pcpu
And let’s look at how it can be used to monitor and analyze process activity.
After executing the command, you will get a list of processes sorted by CPU usage in descending order. Each line represents information about a specific process.

Read more: what our utilities column displays
| Name: | Meaning: |
|---|---|
| USER | Username. |
| PID | Process ID. |
| %CPU | CPU usage percentage. |
| %MEM | Memory usage percentage. |
| VSZ | Virtual memory size. |
| RSS | Resident size (physical memory). |
| TTY | The terminal from which the process was started. |
| STAT | Process status. |
| START | Start time. |
| TIME | Total CPU usage time. |
| COMMAND | Command or executable file. |
When viewing the result, pay attention to the processes that are at the top of the list. If you notice any suspicious processes, you can terminate them by running the command:
- kill PID
- kill -9 PID
With the kill command you can stop a specific process by specifying its PID. The command killall -9 apache2 will kill all Apache processes on the server.
The command killall -u user will kill all user processes.
The
-9option sends a signal that immediately terminates the process, but does not allow it to terminate gracefully. Be careful when using -9, as it may result in data loss or incorrect termination of the process.
Diagnosing the Load on the Nginx web server
If the Nginx web service is installed on the server, using the following command, you can display a list of sites that received the most requests:
- tail -n 10000 /var/log/nginx/access.log | awk '{print $6}' | sort -n | uniq -c | sort -nr | head -n10
The following command will list the IPs that received the most requests:
- tail -n 10000 /var/log/nginx/access.log | awk '{print $1}' | sort -n | uniq -c | sort -nr | head -n10
With the following command you can block access to the server for IP 1.1.1.1.
- iptables -I INPUT -s 1.1.1.1 -j REJECT
To remove a blocking rule, change the -I switch to -D.

